Camp Fire Context
Sensor Calibration
Mapping Smoke Impacts
Maps are critical for communicating information about smoke impacts. The maps below demonstrate how data from monitors and sensors can be combined with metadata from spatial datasets to generate informative, intuitive visualizations.
As of Sunday morning, Nov 18, smoke from the Camp fire has been trapped in large scale terrain features by an atmospheric inversion.
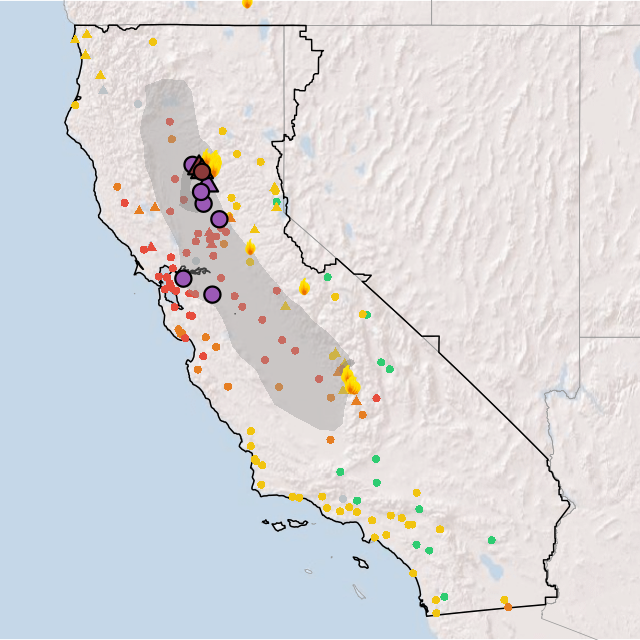
California GACC
The National Inter-agency Fire Center carves up the country into different coordination areas. The following context map displays federal regulatory monitors, fires and smoke plumes for all of California. Smoke is clearly settlling in the central valley.

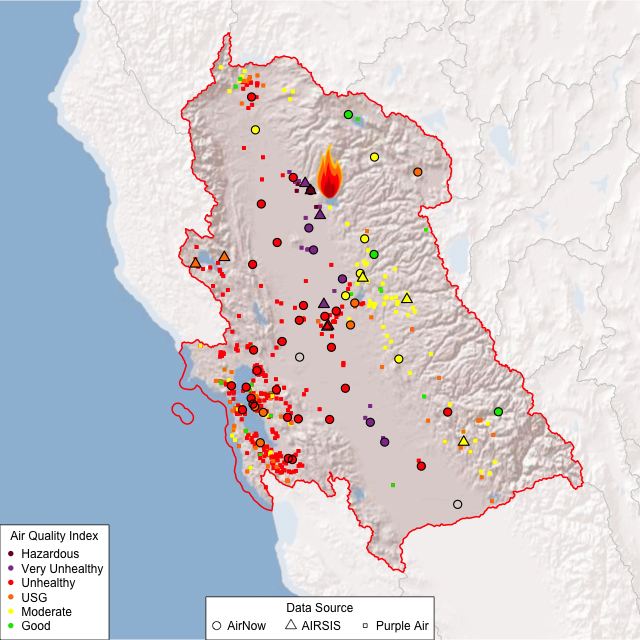
HUC-6 Watersheds
Terrain maps help explain the distribution of PM2.5 measurements.
Watershed boundaries are shown except in the area of interest
where the "Lower Sacramento", "San Joaquin" and "San Francisco Bay" basins
are combined.

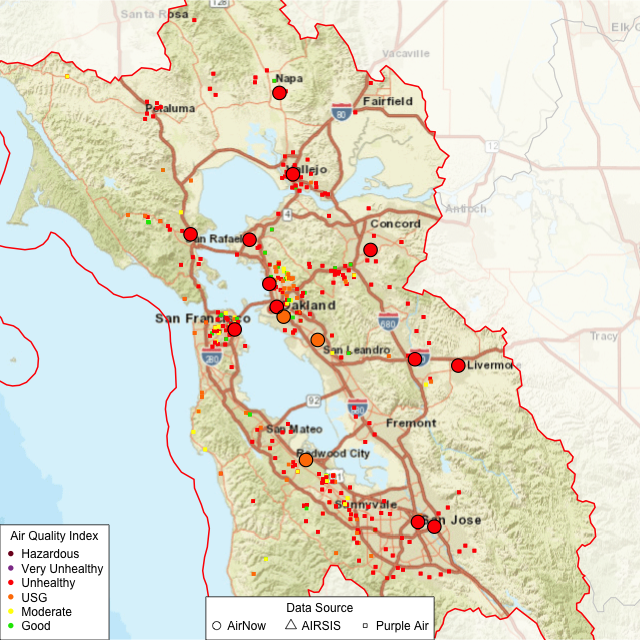
San Francisco Bay
At the metropolitan area scale, it is useful to know where people live.
We can see both the density of small sensors and the variability in their measurements.

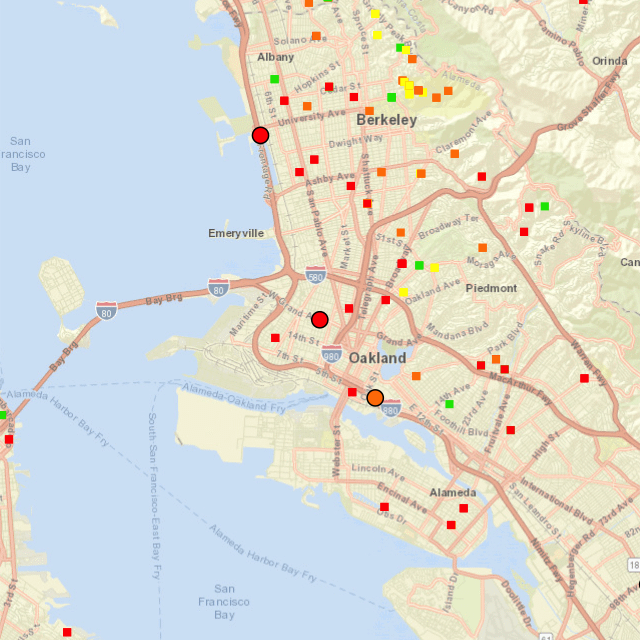
Oakland
At the neighborhood scale, data analysts (including citizen scientists) may begin to identify patterns in the sensor network and choose individual sensors for further data analysis.
