Mapping Smoke Impacts
Sensor Calibration
Context
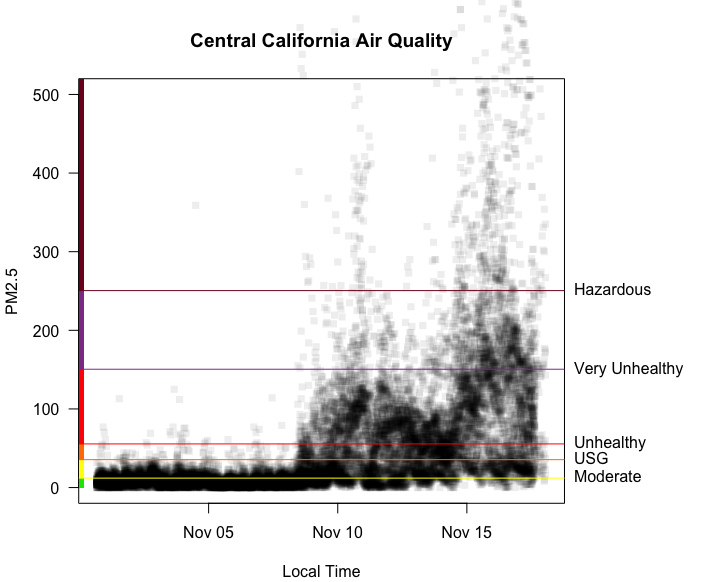
Smoke from the devastating Camp Fire has created a health care crisis throughout northern California with millions of people breathing high concentrations of small particulates over many days.
A plot of all federal regulatory monitoring data from central California during the first half of November shows the unfolding air quality disaster.

There is a strong desire to provide accurate information on air pollution during is episode. The network of federal regulatory monitors provides timely and accurate information but the network of these monitors is quite sparse. Many people are now getting their PM2.5 air quality information from consumer air quality devices and the on-line maps assoicated with them. The Purple Air network has been particularly popular during the current episode.
Hazy skies provide an opportunity to explore the capabilities of new analytical tools for working with inexpensive sensors and comparing it with data from regulatory monitors. The linked pages describe efforts by Mazama Science to develop R packages to work with Purple Air sensor data. This functionality builds upon other R packages developed and maintained by Mazama Science for the US Forest Service Air Fire group.
The functionality being explored was first described at the 2018 Air Sensors International Conference See our Conference Materials for details.